If you’ve ever looked at financial statements, stock reports, or business analyses, you might have noticed the acronym TTM and wondered what it stands for.
Understanding TTM, or Trailing Twelve Months, is essential for anyone interested in finance, investing, or tracking business performance.
Unlike annual or quarterly reports, which provide a snapshot of a company’s results at a specific point in time, TTM offers a rolling view of the past twelve months.
This makes it a valuable tool for measuring revenue, earnings, or other key financial metrics more accurately and consistently.
By looking at TTM data, investors and business owners can identify trends, compare performance over time, and make more informed decisions.
In this article, we’ll break down what TTM really means, how it’s calculated, why it matters, and how you can use it to better understand financial performance in both investing and business contexts.
Breaking Down the Term TTM
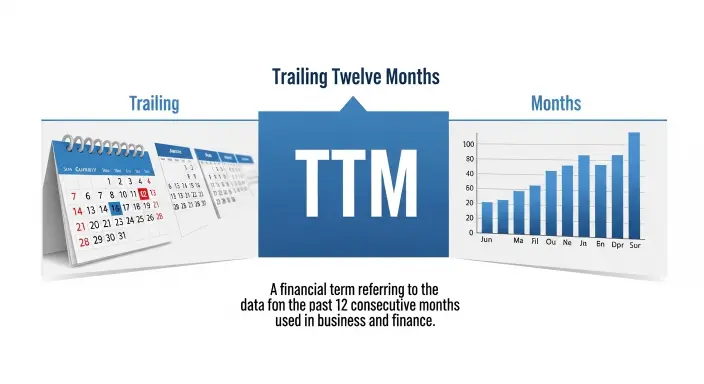
To fully understand TTM, it helps to break down what each part of the term means. TTM stands for Trailing Twelve Months, and each word carries a specific meaning that makes this metric so useful in finance.
“Trailing” refers to a look-back period, meaning it examines data from the past rather than predicting the future.
This is different from forward-looking metrics, which estimate a company’s performance for upcoming months or years.
By focusing on past results, trailing metrics give investors and business owners a more reliable and factual view of financial health.
The “Twelve Months” part simply means the metric covers the most recent 12 months.
Unlike a fiscal year, which is fixed and ends on a specific date, TTM is a rolling period, updating as new monthly or quarterly data becomes available.
For example, if a company’s latest report is for September 2025, the TTM figures would cover October 2024 through September 2025.
This rolling approach is particularly helpful because it smooths out seasonal fluctuations.
For instance, a retail company may earn most of its revenue during the holiday season, making quarterly or annual snapshots less representative. TTM balances these ups and downs to give a clearer picture of ongoing performance.
In the next section, we’ll explore why TTM is important, its key advantages, and the practical ways investors and businesses use this metric to make informed decisions.
Why TTM Is Important
Understanding TTM is crucial because it provides a clear and up-to-date view of a company’s financial performance. Unlike annual reports that only show results at the end of a fiscal year, TTM tracks a rolling 12-month period, giving investors, analysts, and business owners a more accurate and timely snapshot.
This makes it easier to identify trends, evaluate growth, and make decisions based on real, recent data rather than outdated figures.
One of the biggest advantages of TTM is that it smooths seasonal fluctuations. Many businesses experience peaks and valleys during the year for example, retail companies often earn most of their revenue during the holiday season.
Looking at TTM helps average out these highs and lows, providing a more consistent measure of performance.
TTM is also essential for comparing companies. Since it accounts for the most recent 12 months, it allows investors to make fair comparisons between businesses with different fiscal years or reporting cycles.
For instance, if one company reports on a calendar year while another reports on a fiscal year ending in June, TTM aligns their performance periods for meaningful analysis.
Finally, TTM is widely used in valuation metrics like the price-to-earnings (P/E) ratio, revenue multiples, and cash flow analysis.
By focusing on the trailing 12 months, these calculations become more reliable, helping investors make informed decisions without being misled by outdated or incomplete data.
How to Calculate TTM
Calculating TTM is straightforward once you understand the concept of a rolling 12-month period.
Essentially, TTM sums up the financial data such as revenue, net income, or cash flow over the most recent 12 months, regardless of the company’s fiscal year. This provides a more up-to-date picture of performance than a single annual report.
Step 1: Collect Data
Start by gathering the company’s latest quarterly or monthly financial reports. For example, if the most recent report is for September 2025, you will need data from October 2024 through September 2025.
Step 2: Sum the Figures
Add up the relevant metric for each month or quarter. For instance, to calculate TTM revenue, sum the revenue of the four most recent quarters or the last twelve months. Similarly, TTM net income is the sum of net profits over the same period.
Step 3: Adjust for Overlaps (if needed)
If using quarterly reports, make sure you avoid double-counting months. For example, if you use the last four quarters, subtract the overlapping months from the previous year to get an accurate TTM figure.
Example:
Suppose a company reports the following quarterly revenues: Q4 2024: $20M, Q1 2025: $25M, Q2 2025: $30M, Q3 2025: $35M. The TTM revenue ending Q3 2025 = 20 + 25 + 30 + 35 = $110M.
Calculating TTM helps investors and business owners track recent performance trends, compare companies accurately, and make informed financial decisions.
TTM vs Other Metrics
While TTM is a powerful tool, it’s important to understand how it differs from other commonly used financial metrics, so you can interpret data correctly.
TTM vs Annual Reports
Annual reports provide a snapshot of a company’s performance over a fixed fiscal year, often ending on a set date such as December 31.
While useful, annual reports can be outdated if you’re analyzing a company mid-year. TTM, on the other hand, offers a rolling 12-month view, ensuring you are always looking at the most recent performance, regardless of when the fiscal year ends.
TTM vs Quarterly Results
Quarterly reports break performance into three-month periods. While helpful for short-term insights, quarterly data can be affected by seasonality or one-time events, which may not reflect the company’s overall health.
TTM smooths out these fluctuations by aggregating the last 12 months, providing a more consistent and accurate picture.
TTM vs Forward Twelve Months (transgender man/ F12M)
Forward-looking metrics estimate performance for the upcoming 12 months, based on projections or analyst forecasts.
While useful for planning, forward metrics are inherently uncertain. TTM is backward-looking, relying on actual results, making it more reliable for evaluating current performance.
Understanding these differences helps investors, analysts, and business owners choose the right metric for their goals whether evaluating recent performance, planning for the future, or comparing companies.
TTM’s strength lies in its accuracy, timeliness, and ability to normalize seasonal trends, making it a cornerstone metric in finance and investing.
Industries and Scenarios Where TTM Is Most Useful
TTM is a versatile metric used across many industries because it provides a realistic and timely view of financial performance. One of the most common areas where TTM is applied is investing and stock analysis.
Investors rely on TTM revenue, earnings, and cash flow figures to evaluate a company’s health, calculate valuation ratios like the P/E ratio, and make decisions about buying or selling stocks.
In corporate finance and accounting, TTM is essential for internal performance tracking. Companies can use it to monitor trends in revenue, expenses, and profits over the last 12 months, helping management identify strengths, weaknesses, and growth opportunities.
This rolling perspective ensures that decisions are based on the most current data, not outdated fiscal year reports.
Small businesses and startups also benefit from TTM. For businesses with seasonal revenue cycles, TTM smooths out fluctuations, allowing owners to assess the company’s overall performance without being misled by short-term spikes or drops.
TTM is also useful for industry comparisons. When comparing two companies with different fiscal years or reporting schedules, TTM aligns their financial performance, making comparisons fair and meaningful.
Ultimately, TTM is a universal tool for anyone analyzing financial data whether in investing, business management, or market research.
Its ability to provide a consistent, up-to-date picture of performance makes it indispensable for decision-making and strategy planning across industries.
Common Misconceptions About TTM
Although TTM (Trailing Twelve Months) is widely used, many people misunderstand its purpose and application. One common misconception is that TTM predicts future performance. In reality, TTM is a backward-looking metric, summarizing actual results over the past 12 months.
While it provides valuable insights, it doesn’t guarantee future earnings or revenue, so investors should use it alongside other forward-looking indicators.
Another misunderstanding is assuming TTM is the same as the fiscal year or calendar year. Unlike fixed-year reports, TTM is a rolling period, meaning it updates continuously as new monthly or quarterly data becomes available.
This flexibility allows TTM to provide a more current snapshot but can confuse those who expect standard annual reporting.
Some also think TTM is only relevant for large companies, but it’s useful for small businesses and startups as well.
For companies with seasonal sales, TTM smooths out fluctuations, giving a better sense of overall performance rather than focusing on a single quarter or month.
Finally, using TTM without context can be misleading. For example, a company with declining quarterly profits might still have a positive TTM, masking recent challenges.
Therefore, TTM should always be analyzed alongside trends, quarterly results, and industry benchmarks to make informed decisions.
By understanding these misconceptions, readers can use TTM more effectively, avoiding common pitfalls and gaining a clearer perspective on financial performance.
Tools & Resources to Track TTM
Tracking TTM (Trailing Twelve Months) has become easier thanks to a variety of tools and resources designed for investors, analysts, and business owners.
One of the most accessible options is financial websites like Yahoo Finance, Bloomberg, and MarketWatch. These platforms provide TTM data for revenue, earnings, and other key metrics, often calculated automatically, so you don’t have to do the math manually.
For more hands-on analysis, accounting and financial software such as QuickBooks, Xero, and Sage allows businesses to generate TTM reports. These platforms can pull data directly from your accounting records, enabling real-time performance tracking and trend analysis over the last 12 months.
Spreadsheet tools like Excel or Google Sheets are also excellent for calculating TTM, especially if you want to customize metrics or perform scenario analysis.
Investors often combine these tools with stock screeners that filter companies based on TTM revenue, earnings, or growth rates. This helps identify potential investment opportunities efficiently.
Finally, financial news portals and analyst reports can provide TTM-based insights, benchmarks, and comparisons with industry peers, helping you interpret data in context.
By leveraging these tools and resources, you can track, calculate, and analyze TTM effectively, ensuring your financial decisions are based on the most accurate and up-to-date information available.
Key Takeaways:
Understanding TTM (Trailing Twelve Months) is essential for anyone involved in investing, business analysis, or financial planning.
TTM provides a rolling 12-month view of a company’s performance, giving a more accurate and current snapshot than annual or quarterly reports alone.
This makes it a critical tool for evaluating revenue, earnings, cash flow, and other financial metrics.
One of the key benefits of TTM is its ability to smooth out seasonal fluctuations. Many businesses experience peaks and troughs throughout the year, and TTM averages these variations to show consistent trends.
This is particularly useful for investors, as it allows them to make better comparisons between companies or assess a single company’s performance over time.
TTM is also invaluable for financial ratios and valuation metrics, such as the P/E ratio or revenue multiples.
It’s important to remember that TTM is backward-looking, reflecting past performance rather than predicting the future.
While it offers a reliable view of recent trends, it should be used alongside other metrics and forward-looking analysis to get a complete picture.
In summary, TTM is a versatile, widely-used metric that helps investors, analysts, and business owners understand trends, compare companies, and make informed decisions.
By learning how to calculate and interpret TTM, you can confidently analyze financial performance and improve your investment or business strategies.
FAQs:
1. What does TTM mean in finance?
TTM stands for Trailing Twelve Months, which represents a rolling 12-month period of a company’s financial performance. It is commonly used to track revenue, earnings, and other key metrics to get a current and accurate picture of performance.
2. Is TTM always 12 months?
Yes, by definition, TTM covers the most recent 12 months of financial data. Unlike a fiscal year, which has fixed start and end dates, TTM is a rolling metric that updates as new monthly or quarterly data becomes available.
3. How is TTM different from annual revenue?
Annual revenue shows the total for a specific fiscal year, while TTM aggregates the last 12 months of results regardless of fiscal year. This makes TTM more current and useful for ongoing performance analysis.
4. Can TTM be negative?
Yes, TTM can be negative if a company has experienced losses over the trailing 12 months. For example, negative TTM net income indicates the company spent more than it earned during that period.
5. Why is TTM important for investors?
TTM helps investors evaluate trends, compare companies, and make informed decisions. It smooths seasonal fluctuations and provides a more accurate snapshot of recent financial performance, which is critical for calculating valuation ratios like the P/E ratio or revenue multiples.
6. How do I calculate TTM?
TTM is calculated by summing financial metrics (such as revenue or net income) from the last 12 months, often using quarterly or monthly reports. Tools like Excel, Google Sheets, or financial websites can simplify this calculation.
By understanding these FAQs, readers can confidently interpret TTM, avoiding common mistakes and making smarter financial or business decisions.
Conclusion:
In conclusion, TTM (Trailing Twelve Months) is an essential financial metric that provides a rolling view of a company’s performance over the last 12 months.
Unlike annual or quarterly reports, TTM offers a more current, accurate, and comprehensive snapshot of revenue, earnings, and cash flow, making it invaluable for investors, analysts, and business owners alike.
One of the key strengths of TTM is its ability to smooth out seasonal variations and short-term fluctuations, which often distort quarterly or yearly data.
By focusing on the most recent 12 months, TTM helps identify trends, track growth, and evaluate financial stability more effectively. This makes it a crucial tool for investment analysis, business strategy, and performance benchmarking.
TTM also supports better comparisons between companies, even if they have different fiscal years or reporting schedules.
By providing consistent and up-to-date data, it ensures that investors and decision-makers can analyze trends fairly and accurately.
It’s important to remember that TTM is backward-looking, meaning it reflects past results rather than predicting future performance.
To make informed decisions, it should be used alongside other metrics, forward-looking analysis, and industry benchmarks.
By understanding how to calculate, interpret, and apply TTM, you can confidently evaluate financial performance, make smarter investment choices, and improve business decision-making.
If you’re a seasoned investor or a small business owner, mastering TTM gives you a clearer, more reliable picture of financial health and long-term trends.

I am Harper Lee, the voice behind Jokestide.com, where humor meets creativity.
I am here to serve fresh, trending jokes and puns that make every scroll worth it.
I am turning everyday smiles into share-worthy laughs welcome to the fun side of the web